|
|
|
« Back to Action Center
Hosts: Who is Using the Series?  Chart 1: Areas of interest indicated (% of all respondents)
 A wide range of organizations responded, representing foundations, businesses, community-based organizations, research institutes, faith-based groups, nonprofits, government agencies, and educational institutions. Educational, government, and nonprofit groups were most strongly represented, comprising about a fourth of respondents each. About half the organizations had an exclusively local footprint, while 29% worked at the state level and 21% worked nationally. Respondents expressed interest in multiple issues influencing health equity. As presented in Chart 1, public health, children / families, health care delivery, race / ethnicity, and education were their primary interests, while media / journalism and law were least mentioned. Given that the survey was administered only seven months after release of the series, it’s not surprising that the majority of users, the “early adapters,” had a health focus. However, it’s worth noting that 93% of the organizations that indicated a health focus also identified a “non-health” area of interest, implying that most groups using the series have some understanding of their work as cross-sectoral. We classified survey respondents into three general categories:
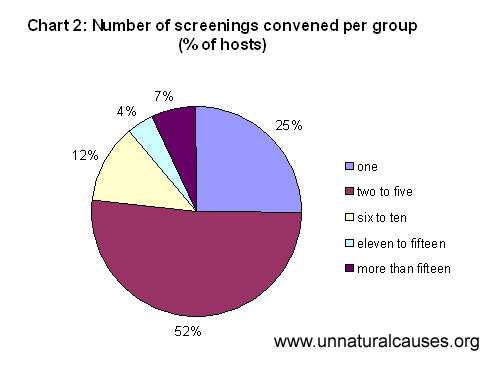 Chart 2: Number of screenings convened per group (% of hosts) Chart 2: Number of screenings convened per group (% of hosts)As shown in Chart 2, the majority of hosts had already conducted two to five screenings, though 11% had already conducted more than 10. We then broke down screenings into two general categories:
|
|
|||
|